



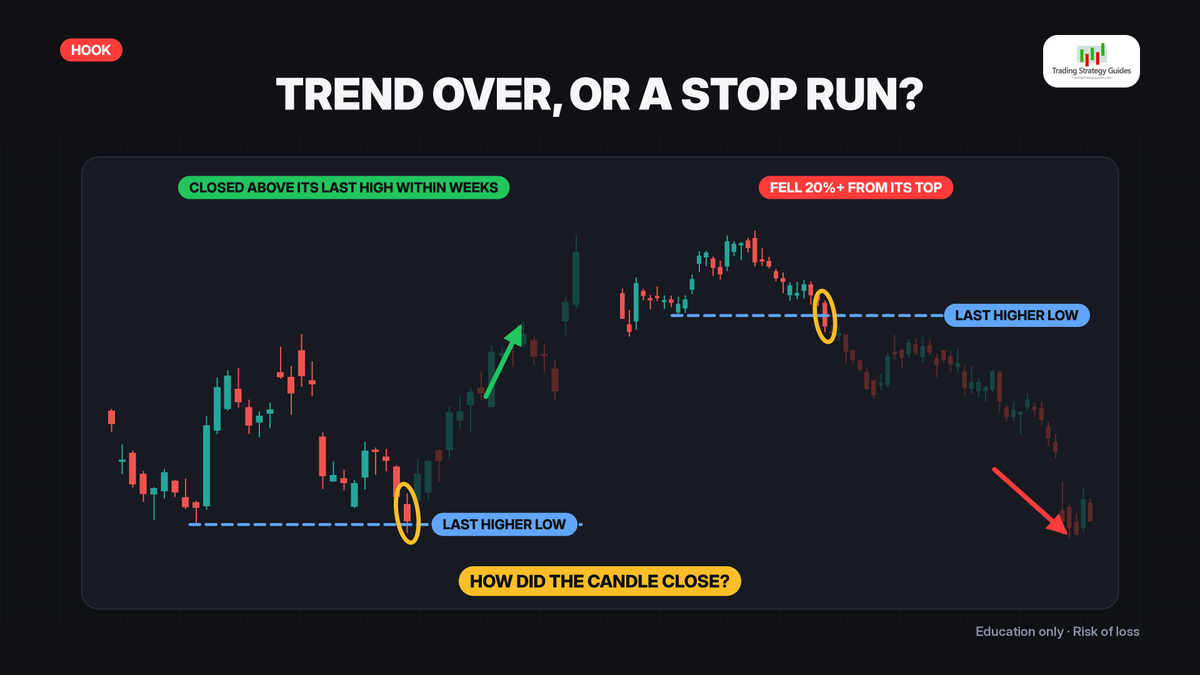
Price breaks a low in an uptrend. Is the trend over, or is it just one more stop run? That question is what BOS vs CHoCH is really about. A break of structure (BOS) says the trend is still doing what trends do. A change of character (CHoCH) is the first sign it might be turning. They look similar in the moment, and mixing them up is one of the most common mistakes in price action and smart money trading.
This guide walks through break of structure vs change of character step by step: how to mark swing points with one fixed rule, the two levels that matter in a trend, a real BOS and a real CHoCH on the same daily chart, why we judge every break on the body close and not the wick, and the fake CHoCH trap where a wick breaks the low and the trend keeps going. Every chart is a real past daily chart. It is educational, not a trade recommendation, and trading involves risk.
Watch: BOS vs CHoCH: Is the Trend Over or Not?

Here are two real daily charts. Both were trending up, and both dropped below their last higher low. The first one closed above its last high 11 trading days later. The second one fell more than 20% from its top. The difference was not the size of the drop. It was how the candle closed.
Step 1: mark swing points with one fixed rule
Market structure is built on swing points, so the first job is to mark them the same way every time. In this guide, a swing high is a candle whose high is above the highs of the 5 candles on each side of it. A swing low is the mirror image: a low below the lows of the 5 candles on each side. You can use a different number, but do not change it from chart to chart, or every wiggle will start to look like a signal. Our older guide on identifying swing highs and swing lows covers more ways to draw them.

One catch that a lot of traders skip: you only know a swing high is confirmed 5 candles later, once those right-hand candles have printed. Structure is always a little behind price. That is fine, as long as you know it.
Step 2: read the structure (higher highs, higher lows)
Now connect the swings. An uptrend is a series of higher highs and higher lows: each pullback stops above the last one, and each rally pushes past the last peak. A downtrend is the mirror: lower highs and lower lows. You do not need an indicator to see it. On the chart below, the sequence is higher low, higher high, higher low, higher high.

Step 3: find the two levels that matter
In an uptrend, two levels matter most. The last swing high above price, and the last higher low below it. That higher low is the one that launched the latest push to a new high, and many smart money traders call it the protected low. As long as price closes above it, the uptrend structure is intact.

A close above the last swing high is where you look for a break of structure. A close below the protected low is where you look for a change of character. Everything else in between is noise as far as structure is concerned.
What is a break of structure (BOS)?
A break of structure in an uptrend is a candle that closes above the last swing high. It breaks the structure in the same direction as the trend, so it signals continuation: the trend just made another higher high. In a downtrend, it is the mirror: a close below the last swing low.
Here is a real one. After the higher low, price pushed back up. The day before the break, it poked above the old high on a wick but closed below it, so that day does not count. The next day, 3 trading days after the higher low, it closed above the high. That close is the break of structure. From there price ran to a new high, and the higher low behind the break became the new protected low.

What is a change of character (CHoCH)?
A change of character in an uptrend is the first candle that closes below the protected low. For the first time, a pullback did not hold above the last one, so the higher-low pattern is broken. It is the first sign that the trend may be turning. It is not proof of a downtrend. Not yet. (Some traders call a similar idea a market structure shift, or MSS.)
Back to the same chart. 10 trading days after the top, a candle opened above the protected low and closed below it. The body went right through the level. That close was about 7% below the top. That is a change of character: the higher-low pattern that carried the whole uptrend had failed, on a close.

Confirmation: the lower high, then a BOS down
What happened next is what confirmed it. Price made a lower low, then bounced, but the bounce stalled under the broken low and never got back to it. That is a lower high. About five weeks after the change of character (25 trading days), price closed below the last swing low. That is a break of structure again, now in the new direction: lower highs and lower lows, a downtrend.

By its next swing low, the stock was more than 20% below its top. But notice the order. The change of character did not catch the exact top; it came about 7% down. The lower high and the break of structure down confirmed it later. That is the honest way to use a CHoCH: as an early warning, not a prediction.
BOS vs CHoCH: the difference in one picture

- Break of structure (BOS): goes with the trend. In an uptrend, a close above the last swing high. It says continuation.
- Change of character (CHoCH): goes against the trend. In an uptrend, a close below the protected low. It says the trend might be over.
- Both are judged on the close, never on the wick.
Body close vs wick: count closes
That last rule saves you from a lot of bad calls. A wick below a level only means price visited it. A close below means the day ended there, after buyers had the whole session to push it back. So count closes, not wicks. If a candle spikes below the protected low and closes back above it, that is not a change of character. The same logic decides a trendline break in our guide to drawing trendlines correctly.

The fake CHoCH trap
Here is what the trap looks like on another real daily chart, also in an uptrend: higher low, higher high. Then one day, price dropped less than 1% below the protected low and closed back above it. On wicks, that was a lower low. On closes, the structure never broke. Anyone who called the trend over on that wick called it too early.

The wick low held, and price never closed below the protected low. 11 trading days later, it closed above the last swing high: a break of structure, up. And it kept going to new highs. That wick was a stop run, not a reversal.

Why the trap works
The protected low is obvious. Plenty of traders put their stops just under it, and plenty of sellers wait there for a breakdown. A quick push below can trigger those orders, and then price snaps back. That is a liquidity sweep, and it is exactly the close-back-in rule for liquidity sweeps: a sweep that closes back inside is not a break. Wait for the close. If you trade ICT concepts, the same patience applies to the gaps price leaves behind; see our guide to fair value gaps.
3 market structure mistakes
- Calling every wick through a low a change of character. Only a close counts.
- Using swings that are too small. On tiny swings, every wiggle looks like a break. Pick one swing rule and stick to it.
- Treating one change of character as a signal on its own. It is a warning. The lower high and the break of structure down are what confirm a new trend.
The market structure checklist

- Is price making higher highs and higher lows, or lower highs and lower lows?
- Where is the last swing high, and where is the protected low?
- Did a candle close through the level, or just wick through it?
- Is that close with the trend (a break of structure) or against it (a change of character)?
- After a change of character, wait for the lower high before calling a downtrend.
Then practice: mark the swings on ten past charts and label every break, using closes only. Structure works best next to real levels, so pair it with our guide to support and resistance zones, and if the smart money vocabulary is new, start with smart money concepts explained. No signal works every time, and past examples do not predict future results.
BOS vs CHoCH FAQ
What is the difference between BOS and CHoCH?
A break of structure is a close beyond the last swing point in the direction of the trend (continuation). A change of character is the first close through the protected swing point against the trend (an early sign of reversal). Same kind of event, opposite meaning.
Does a CHoCH mean the trend has reversed?
No. It is the first warning. In the example above, confirmation came later, when price made a lower high and then broke structure to the downside. Until then, a change of character can still fail.
Should I use the wick or the body close?
Use the close. A wick through a level only shows price visited it. The fake CHoCH example closed back above the protected low and went on to new highs.
What is a protected low?
In an uptrend, it is the last higher low, the swing low that launched the latest higher high. As long as price closes above it, the uptrend structure is intact.
Every chart in this guide is a real past example for education only. These are not trade recommendations, past examples do not predict future results, and trading involves risk of loss.


